Weixin Service

 DouYin
 KuaiShou

Introduction to the basic principles and methods of chemical composition analysis
Date:2022-02-18 16:23:00Views:1061
1、 Chemical analysis method
Chemical analysis is classified into classical gravimetric analysis and volumetric analysis. Gravimetric analysis refers to the calculation of the chemical composition of the sample according to the mass of the product generated by the chemical experimental reaction of the sample. Most of them refer to the mass method. Volumetric method refers to the volume of standard test solution consumed by the sample in the reaction. The volumetric method can determine the main components of the sample and the secondary components of the sample.
1.1 gravimetric analysis
It refers to adding chemical reagent to change the substance to be tested into corresponding precipitate, and determine the content of the substance to be tested by measuring the quality of the precipitate.
1.2 capacity analysis
Titration analysis is mainly divided into acid-base titration analysis, complexometric titration analysis, redox titration analysis and precipitation titration analysis.
Acid base titration analysis refers to the principle of acid-base neutralization reaction, using acid calibrators to titrate alkaline substances or using alkaline calibrators to titrate acidic substances to be measured. Finally, the end point of titration is determined by the change of acid-base indicators (such as phenolphthalein), and the content of substances to be measured is determined by the amount of calibrators added.
Complexometric titration analysis is a titration analysis method based on complexation reaction (formation of complex). For example, EDTA reacts with metal ions to determine the content of metal ions. Complexation reaction is widely used in various separation and determination of analytical chemistry, such as many chromogenic agents, extractants, precipitants, masking agents and so on. Therefore, the theoretical and practical knowledge of complexation reaction is one of the important contents of analytical chemistry.
Redox titration analysis: it is a titration analysis method based on the electron transfer between oxidant and reductant in solution. Redox titration is widely used. It can be used not only for inorganic analysis, but also for organic analysis. Many oxidizing or reducing organic compounds can be determined by redox titration. It is usually judged by indicators. Some titrant solutions or substances to be titrated have deep enough color. If they fade after reaction, they can act as indicators, such as potassium permanganate. Soluble starch and trace iodine can produce dark blue. When iodine is reduced to iodine ions, the dark blue disappears. Therefore, starch solution is usually used as an indicator in iodometry.
Precipitation titration analysis: it is a titration analysis method based on precipitation reaction, also known as silver content method (a volumetric analysis method that can react with Ag + to form insoluble precipitation with silver nitrate solution as titration solution). Although there are many precipitation reactions that can be carried out quantitatively, there are few reactions applied to precipitation titration due to the lack of appropriate indicators. At present, the silver method is of practical significance.
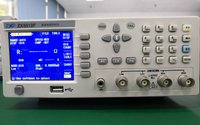
_20220218175219_370.jpg "化学成分分析的基本知识 方法及原理介绍")
2、 Instrumental analysis
2.1 electrochemical analysis
It refers to a kind of analytical method established by applying electrochemical principle and technology, which uses the principle of galvanic cell model to analyze the electrode type of the measured sample, the composition and content of electrolyte and the relationship between the electrochemical properties of the two. At present, electrochemical workstation is generally used to test samples. It is characterized by high sensitivity, good selectivity, simple equipment, convenient operation and wide application range. According to different measured electrical signals, electrochemical analysis methods can be divided into potentiometry, electrolysis, conductivity and voltammetry.
Potentiometric method is an analytical method to obtain the content of the substance to be measured by measuring the electrode electromotive force. If the content of the substance to be measured is calculated directly according to the measured value of electrode potential, it is called direct potential method; If the end point of titration is determined according to the change of electrode potential in the titration process, it is called potentiometric titration.
Electrolytic method is an analytical method to determine the content of the substance to be measured according to the quantitative deposition of the substance to be measured on the electrode when it is energized.
Conductivity method is an analytical method that measures the conductivity of analytical solution to determine the content of substance to be measured according to the principle that the solubility of solute in electrolyte solution is different and its conductivity is also different.
Voltammetry is an electrochemical analysis method that inserts a microelectrode into the solution to be measured and makes qualitative or quantitative analysis according to the current voltage change curve of the measured substance in the electrolysis process.
2.2 photochemical analysis
Photochemical analysis is a chemical analysis method based on the emission and absorption of electromagnetic radiation and the interaction between matter and electromagnetic radiation after energy acts on matter. The spectral method and non spectral method can be divided into two main categories. Spectroscopy is a method based on measuring the wavelength and intensity of emitted, absorbed or scattered radiation generated by the transition between non quantized energy levels when radiant energy interacts with matter. It mainly includes atomic absorption spectrometry (AAS), atomic emission spectrometry (AES), atomic fluorescence analysis (AFS), infrared spectroscopy (IR), etc. Non spectral method is to test substances based on the fluctuation of light, mainly including spectrophotometry and polarimetry.
2.2.1 atomic absorption spectrometry (AAS)
Atomic absorption spectrometry is established by using the phenomenon that gaseous atoms can absorb a certain wavelength of light radiation and make the electrons in the outer layer of atoms transition from the ground state to the excited state. Due to the different energy levels of electrons in various atoms, they will selectively resonantly absorb radiation light of a certain wavelength, which is exactly equal to the wavelength of the emission spectrum of the atom after excitation, which can be used as the qualitative basis of elements, and the intensity of absorbed radiation can be used as the quantitative basis.
The basic principle is that the atoms of each element can not only emit a series of characteristic spectral lines, but also absorb the characteristic spectral lines with the same wavelength as the emission line. When the light of a certain characteristic wavelength emitted by the light source passes through the atomic vapor, that is, the frequency of the incident radiation is equal to the energy frequency required for the electrons in the atom to transition from the ground state to the higher energy state (generally * excited state), the outer electrons in the atom will selectively absorb the characteristic spectral lines emitted by the same element to weaken the incident light. The degree of attenuation of the characteristic spectral line due to absorption is called absorbance a, which is directly proportional to the content of the measured element: a = KC, where k is a constant; C is the sample concentration; K contains all constants. This formula is the theoretical basis of quantitative analysis by atomic absorption spectrometry. Because the atomic energy level is quantized, the atomic absorption of radiation is selective in all cases. Due to the different atomic structure and arrangement of outer electrons of each element, the energy absorbed by the element when it transitions from the ground state to the * excited state is different, so the resonance absorption lines of each element have different characteristics.
2.2.2 atomic emission spectrometry (AES)
Atomic emission spectrometry is a method for qualitative and quantitative analysis of elements based on the characteristic electromagnetic radiation emitted by the atoms or ions of various elements under thermal or electrical excitation. It is the oldest branch of spectroscopy. It can detect multiple elements in a sample at the same time.
Its basic principle is that the atomic nucleus of the constituent elements of each substance is surrounded by moving electrons, which are at a certain energy level and have a certain energy. From the whole atom, in a certain state of motion, it is also at a certain energy level and has a certain energy. In general, most atoms are in the lowest energy level state, that is, the ground state. The ground state atom obtains enough energy under the action of the excitation light source (i.e. external energy), and its outer electrons transition to the excited state of the higher energy level state. This process is called excitation. The atom in the excited state is very unstable. In a very short time (10s), the outer electrons will transition back to the ground state or other lower energy states and release excess energy. The way to release energy can be to transfer energy through collision with other particles, which is a non radiation transition, or it can be radiated out in the form of electromagnetic wave with a certain wavelength. The released energy and the wavelength (frequency) of the radiation line should comply with Bohr's energy law.
2.2.3 atomic fluorescence spectrometry (AFS)
Atomic fluorescence analysis is an emission spectrum analysis method that quantitatively analyzes the fluorescence intensity emitted by atoms excited by radiation energy. However, the instrument used is similar to that of atomic absorption spectrometry. Atomic fluorescence spectrometry has high sensitivity, wide linear range of correction curve and can determine multiple elements at the same time. Atomic fluorescence spectrum is a spectral analysis technology between atomic emission spectrum and atomic absorption spectrum.
Its basic principle is quantitative analysis by measuring the fluorescence intensity emitted by the atomic vapor of the element to be measured under the excitation of a certain wavelength of radiation energy. The wavelength of atomic fluorescence is in the ultraviolet and visible regions. After the gaseous free atom absorbs the radiation of the characteristic wavelength, the outer electrons of the atom transition from the ground state or low-energy state to the high-energy state. After about 10-8 seconds, they transition to the ground state or low-energy state and emit fluorescence at the same time. If the wavelength of atomic fluorescence is the same as that of the absorption line, it is called resonance fluorescence; If different, it is called non resonant fluorescence. Resonance intensity is the most widely used in fluorescence analysis. Under certain conditions, the resonance fluorescence intensity is directly proportional to the concentration of an element in the sample, so the content of the element to be measured can be determined by testing the resonance fluorescence intensity.
2.2.4 Spectrophotometry
Spectrophotometry is a method for qualitative and quantitative analysis of the substance by measuring the absorbance or luminous intensity of the light at a specific wavelength or within a certain wavelength range.
The basic principle is that in the spectrophotometer test, when the light of different wavelengths is continuously irradiated to a certain concentration of sample solution, the absorption intensity corresponding to different wavelengths can be obtained. Then by wavelength( λ) Is the abscissa and the absorption intensity (a) is the ordinate, the absorption spectrum curve of the substance can be drawn. The qualitative and quantitative analysis method of substances using this curve is called spectrophotometry, also known as absorption spectrometry. The method of determining colorless substances with ultraviolet light source is called ultraviolet spectrophotometry; The method of measuring colored substances with visible light source is called visible spectrophotometry.
2.2.5 optical rotation method
Optical rotation method is based on the optical activity of many substances, such as organic compounds containing chiral carbon atoms, so as to determine the concentration of solution by using the optical rotation of substances.
The basic principle is to prepare the sample into a solution with a certain concentration in the specified solvent, measure the rotation of the sample with a polarimeter and calculate the specific rotation, and then compare it with the standard, or prepare a standard curve, i.e. working curve, with different concentration solutions to calculate the content.
2.3 chromatographic analysis
Chromatographic analysis refers to the elution of the mixture in the mobile phase relative to the stationary phase by using the selective distribution of different substances in different phase states. Different substances in the mixture will move along the stationary phase at different speeds, and finally achieve the effect of separation. There are two phases in chromatography, one is mobile phase and the other is stationary phase. If liquid is used as the mobile phase, it is called liquid chromatography, and if gas is used as the mobile phase, it is called gas chromatography.
2.3.1 gas chromatography
The basic principle of gas chromatography is to use a long and narrow pipeline (chromatographic column) in the gas chromatograph. In the chromatographic column, different samples have different physical and chemical properties and have different interactions with specific column filler (stationary phase), so they are driven by gas flow (carrier gas, mobile phase) at different rates. When compounds flow out from the end of the column, they are detected by the detector, generate corresponding signals, and are converted into electrical signal output. In the chromatographic column, the function of stationary phase is to separate different components, so that different components flow out of the end of the column at different times (retention time). Other factors affecting the sequence and retention time of substances flowing out of the column include the flow rate and temperature of carrier gas. There are many kinds of detectors that can be used in gas chromatography, the most commonly used are flame ionization detector (FID) and thermal conductivity detector (TCD).
2.3.2 liquid chromatography
The basic principle of liquid chromatography is based on the difference of affinity and force of each component in the mixture. According to different stationary phases, liquid chromatography can be divided into liquid-solid chromatography, liquid-liquid chromatography and bonded phase chromatography. The most widely used are liquid-solid chromatography with silica gel as filler and bonded chromatography with micro silica gel as matrix. According to the form of stationary phase, liquid chromatography can be divided into column chromatography, paper chromatography and thin layer chromatography. Sorption chromatography can be divided into adsorption chromatography, partition chromatography, ion exchange chromatography and gel permeation chromatography. In recent years, the high-pressure liquid flow system is added to the liquid column chromatography system to make the mobile phase flow rapidly under high pressure, so as to improve the separation effect. Therefore, the (also known as high-pressure) liquid chromatography appears. The detectors mainly include ultraviolet absorption detector, fluorescence detector, electrochemical detector and refractive differential detector, among which ultraviolet absorption detector is the most widely used.
2.4 spectrum analysis
Spectral analysis refers to that a substance under the irradiation of light (electromagnetic wave) causes some movement inside the molecule, so as to absorb or scatter light of a certain wavelength, record the change of incident light intensity or the signal of scattered light, and obtain a diagram of the relationship between signal intensity and light wavelength or wave number (frequency) or scattering angle, which is used for the analysis of material structure, composition and chemical changes, This is called spectral method. Spectrum method mainly includes infrared spectrum, ultraviolet spectrum, nuclear magnetic resonance and mass spectrometry, which is called four spectrum for short. In addition, it also includes Raman spectrum and so on.
2.4.1 infrared spectroscopy (IR)
Infrared spectroscopy is a kind of molecular absorption spectrum. It forms the infrared absorption spectrum of this molecule by irradiating a beam of infrared rays with different wavelengths on the molecules of substances, and some infrared rays with specific wavelengths are absorbed. Each molecule has a unique infrared absorption spectrum determined by its composition and structure, according to which the molecular structure can be analyzed and identified. It is mainly used to test the valence bond structure of organic molecules and the types of functional groups.
The basic principle is that when a beam of infrared light with continuous wavelength passes through a substance, and the vibration frequency or rotation frequency of a group in the substance molecule is the same as that of infrared light, the energy absorbed by the molecule will transition from the original ground state vibration (rotation) kinetic energy level to the higher energy vibration (rotation) kinetic energy level, and the vibration and rotation energy level will transition after the molecule absorbs infrared radiation, Light at that wavelength is absorbed by the material. Therefore, infrared spectroscopy is essentially an analytical method to determine the molecular structure of substances and identify compounds according to the information of relative vibration and molecular rotation between atoms in molecules.
2.4.2 ultraviolet spectroscopy (UV)
Ultraviolet spectroscopy is an analytical method to determine the absorption spectrum of substances and molecules in the ultraviolet region. Its basic principle is that after a substance absorbs ultraviolet light, its valence electrons transition from low energy level to high energy level, and must absorb light with a wavelength in the range of 200 ~ 1000 nm, which falls just in the ultraviolet visible region, resulting in corresponding absorption peaks. Not all organic substances have absorption in the ultraviolet region. Only those compounds with conjugated double bonds (π bonds) are easy to be excited and transition, forming characteristic absorption peaks in the ultraviolet region.
2.4.3 nuclear magnetic resonance spectroscopy (NMR)
Nuclear magnetic resonance spectroscopy refers to the spectrum generated by the atomic nucleus (or magnetic nucleus or spin nucleus) with nuclear magnetic properties, which absorbs RF radiation and causes the transition of nuclear spin energy level under the action of high-strength magnetic field, which is called nuclear magnetic resonance spectroscopy. The method of using nuclear magnetic resonance spectroscopy for analysis is called nuclear magnetic resonance spectroscopy.
2.4.4 mass spectrometry
Mass spectrometry refers to the method of detecting moving ions (charged atoms, molecules or molecular fragments, including molecular ions, isotopic ions, fragment ions, rearranged ions, multi charged ions, metastable ions, negative ions and ions produced by ion molecule interaction) after they are separated according to their charge mass ratio by electric field and magnetic field. The compound composition of ions can be determined by measuring the accurate mass of ions. This is because the accurate mass of nuclides has many decimals. There will never be two nuclides with the same mass, and the mass of one nuclide will never be exactly an integer multiple of the mass of the other nuclide. By analyzing these ions, we can obtain the molecular weight, chemical structure, cracking law and some mutual relationship between some ions formed by single molecule decomposition.
The basic principle is to ionize each component in the sample to generate ions with different charge mass ratio. After accelerating the action of the electric field, the ion beam is formed and enters the mass analyzer. The opposite velocity dispersion occurs by using the electric field and magnetic field. In the magnetic field, the ions have the opposite deflection of angular velocity vector, that is, the ions with slow velocity still have large deflection and the ions with fast velocity have small deflection; When the deflection of the two fields compensates for each other, their orbits intersect at a point. At the same time, mass separation can also occur in the magnetic field, so that ions with the same mass charge ratio and different velocities can be focused on the same point, and ions with different mass charge ratio can be focused on different points to obtain mass spectra, so as to determine their mass.
2.4.5 Raman spectroscopy
Raman spectroscopy is a kind of scattering spectroscopy. Raman spectrum analysis is an analysis method based on the Raman scattering effect discovered by Indian scientist C.V. Raman, which analyzes the scattering spectrum different from the incident light frequency to obtain the information of molecular vibration and rotation, and is applied to the study of molecular structure.
Its basic principle is that elastic scattering and inelastic scattering will occur when light irradiates the material. The scattered light of elastic scattering is the same component as the wavelength of excitation light, and the scattered light of inelastic scattering has components longer and shorter than the wavelength of excitation light, which is collectively referred to as Raman effect. Because Raman effect originates from molecular vibration (and lattice vibration) and rotation, the knowledge of molecular vibration energy level (lattice vibration energy level) and rotation energy level structure can be obtained from Raman spectrum. Of which). If the transition of molecular energy level only involves the rotational energy level, the small Raman spectrum is emitted; If the vibrational rotational energy level is involved, the large Raman spectrum is emitted.